Japan - Engine Failure
 Last time I had Japan under the loop I asked whether there was no end in sight for Japan's economy and as I wind up for another close look, I must say that it is still very difficult to find good news if any at all. However, and for the sake of argument I thought that we might begin with some recent arguments in the context of the global economy which suggest that we may be past the worst of our travails. The first observation comes from the Economist's ever eloquent financial markets pundit, Buttonwood, who recently made the neat point that while we are still stuck in the mire, the second derivative might be turning positive. This suggests that while indicators are still on the decline they are now declining less rapidly. In Tokyo, Cassandra voices a similar sentiment as she takes stock of the number presented earlier last week by the Asian Development Bank that as much as USD 50 trillion, so far, has vanished into thin air during this crisis. Hovering between the "half full, half empty" metaphor Cass notes;
For the moment, I'll take the middle ground and venture that having shed an awful lot of aggregate value (an entire year of global GDP according to the ADB!), we're a lot closer to where we're going than we were.
It may come to a surprise to my readers given the traditional very bearish sentiment expressed at this space, but I actually agree with Buttonwood and Cassandra here. However, I would simply add the important qualifier that there will be a significant asymmetry in terms of where individual economies are going as a function of where they are and were. No where is this more true in the case of Japan and as we progress to the data and analysis it should be abundantly clear that for all the talk of second derivatives and glasses being half full, Japan still look to be in an extraordinarily bad shape. Initial evidence of this comes from the headline GDP figures which don't seem to be blessed with any second derivative effects.
Final estimates from Q4 2008 suggested that Japan contracted at an annualized 12.1% which puts Japan in the dubious pole position of biggest GDP declines among industrialised economies. Q1 estimates are yet to be released, but no-one expects, I think, an improvement as the incoming data so far has been nothing but extraordinarily poor. Sociétè Generale expects Japan to contract sharply in 2009 with Q1 as an forecast bottom. I am not sure about the bottom in the sense that while it may be a bottom in the sense of the second derivative noted above, it won't likely mark a return to sustained growth.
In this note, I will provide an overview of the recent developments in the Japanese economy. Since we last convened some interesting points have emerged. For one, Japan is back in deflation measured on the US style core price index and for the first time in a very long time Japan is now running a current account deficit. This last point will be studied in some detail since it marks a very important issue for the export dependent Japanese economy both in a historical and a current perspective. Before we begin I should note that this post is very big with a lot of graphs and even an econometric model to boot. I understand full well if this deters some of my readers; I shall not hold it against you.
Prices and Consumption, where art thou?
If there is one thing which has been stable in Japan throughout this crisis it has been the persistent sluggish trend in domestic demand measured by top line household consumption expenditures as well as prices on the other hand. These two data points consequently tell an important part of the story of the lack of domestic demand in Japan or more specifically the lack of visible momentum to pull Japan out of the doldrums. One persistent feature of the initial phases of the crisis where markets and global policy makers primarily looked towards the risk of stagflation was that inflation in Japan exclusively was driven by cost-push factors in the form of headline inflation and not demand pull factors. This idea is a well established one at this point, and materialised itself in the fact that as headline inflation shot through the roof core inflation only budged slightly. It is important to point out that this inelasticity cuts both ways and as headline inflation has abated (for now), so has the spread between the two indices narrowed significantly. The underlying point here is thus two-fold. One the one hand it is dangerous to assume that inflation driven by domestic demand conditions will correlate with external headline inflation pressures which, due to global capacity constraints and global demand conditions, look set to shoot higher the minute we move even slightly beyond the current malaise. On the other hand however, we can clearly see, in Japan, that whatever trend we see for headline inflation domestically induced price pressures in Japan are virtually non-existing and now that the crisis is seriously biting Japan is set once again to retrench into deflation despite the central bank's most ardent efforts to apply measures of quantitative easing.
As I have argued before, I believe a large part of Japan's problem with deflation is demographic. In particular, I think that because Japan is basically unable to achieve growth based on domestic momentum a growth scenario strictly based on domestic activity as the one we are seeing at the moment will be de-facto deflationary. However, since Japan is largely dependent on energy imports in so far as goes its consumption of fossil fuels (i.e. a high passthrough effect) the overall inflation indice will diverge from the core of core index which, in Japan's case, is a good proxy for domestically induced price pressures. Now, I realize that my readers will be skeptical of the demographic link here, but let me at least present results that show the broken link between the general price index and core of core prices (which exclude energy and food). Thanks to a novel data set from Japan' statistical office giving us monthly inflation rates (y-o-y) for all three recorded inflation indices since 1971 we have plenty of ammunition on our hands to proceed. In the following all numbers will be based on de-trended time series which in this case simply means that I am using the first difference.
Consider then the very simple representation below which shows the correlation between the general index and core of core index over the entire sample, from 1971-1996 and from 1997-2008.
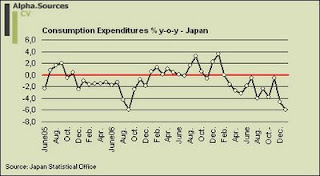
Turning briefly to the consumption expenditures and thus the state of the Japanese consumer it really is (un)steady as she goes. Some analysts have expressed the opinion that the Japanese consumer has held up alright up until this point in the crisis. I am not sure what data these analysts are looking at. All I know is that the headline figure for consumption expenditures is still clocking in one negative number after the other and in this light it is difficult to see from where the much awaited boost in domestic demand is going to come from; note for example here that autosales dropped a healthy 27.9% in January. Add to this that retail sales dropped 5.8% on an annual basis with the subcomponent and you have firm evidence of a slump.
To be fair, the latest reading on consumer confidence did show an uptick in February compared to January as well as the economy watchers index which measures the performance of non tradables showed an improvement, but the accompanying comments from analysts on the ground do not provide much comfort for the outlook where most domestic companies are preparing their operations for a tough recession. Ken Worsley parses the entrails of the consumer confidence report and notes that the slight increase in the willingness to buy consumer durables is a welcome sign although the overall picture is weighed down by a mounting insecurity over job safety and thus income.
Investment, huddling up for hibernation?
If the charts for consumer spending shows us that the Japanese consumer is performing decidedly worse than past years' mean, the corresponding charts and numbers of industrial production and industrial orders resemble clear depression tendencies.
It is important to note the difference between the plots above. Consequently, what we are seeing in Japan at the moment is especially a massive slump in manufacturing and industrial production dragged down by the sharp drop in external demand. In this way, the export sector so important for Japan's growth is inexorably tied together with industrial production. In the last post the graph did not include Q4 2008 and as is readily clear from the charts above Q4 08 was the breaking point for Japan (and most others too).
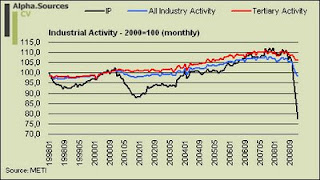
This picture is confirmed if we look at the monthly reading. Since the data graphed above is from the METI, the data is lacking relatively to the present in that we only have data up until January 2009 (for the monthly chart). However, just look at that line go as if it is being pulled down by gravity itself. Needless to say that the overall index is being dragged down here even if the tertiary index, which accounts for 3 times as much as industrial production in the overall index, is holding up quite well. On an annual basis, industrial production dropped a full 31% in terms of production and 31.6% in terms of shipments. Inventories decreased on a monthly basis, but are still well above their 2000 levels which makes me wonder what kind of information the analysts claiming that Japanese companies had comparatively low inventories going into this were looking at. As for the small bounce in tertiary industry postal services seem to be the main culprit increasing with a full 11%.
As for the link between manufacturing and exports, I am going to let Danske Bank's analysts do the heavy lifting and display their wonderful graph plotting industrial production and exports.
I don't think this requires much interpretation and the main points is well articulated by Danske;
In Japan, manufacturing accounts for about 22% of GDP compared with just 17% and 12% of GDP in Euroland and the US, respectively. For that reason, there is a larger negative secondary impact on particularly investment demand from the recent collapse in global trade and industrial production.
 The outlook here is thus completely dependent on where you think global growth is heading. Given the increasing indications that the slump will be prolonged the outlook is bleak. Of course, and coming back to that dreaded second derivative the decline will stabilise at some point, especially as inventories are cut. Yet, the key is the extent to which it will recover to anywhere near past levels. Surely Japan will be ready when the world is about to take off again but there is a lot to suggest that the margins on export led growth will be a lot thinner than they are now since everybody seems to be in the midst of a transition towards the same growth strategy. In this light it seems as if Japanese manufactures may indeed be tucking themselves in for a prolonged hibernation.
Evidence to suggest this came recently from the hands of Morgan Stanley analyst Takehiro Sato who had an excellent analysis looking forward to the upcoming Tankan survej of Japanese industry. The key is that companies are expected to revise down their capex and investment plans drastically. Moreover, the most recent print for industrial production in the form of the preliminary report for February indicates that industrial production in Japan contracted at an annual 38.4%. In light of this extraordinary decline, Bloomberg is running a piece with the overall point that because Japanese manufacturers have been so fast in adjusting down their inventories (getting rid of excess capacity) we will soon see a pick-up as inventories have been cleared. The logic of this argument is indisputable, but I think that the underlying point is misplaced for two principal reasons. For starters, the recovery argument only holds if in a standard cyclical downturn and since the current debacle is clearly different I am weary about applying any kind of conventional wisdom here. Obviously, if inventories go to zero we get that famous "second derivative effect" noted above, but the overall level of growth and increase in production is likely to be very low if not negative. We should Remember that there is indeed a flipside to all these horrendous numbers coming in now and this is what level we will end on and how long it will take for us to get back up.
Finally and just to show that the crisis has had a notable effect in the market too just watch the absolute horrible performance of the main Nikkei index.
I am no equity analyst so I shall not belabour this point a lot, but merely note my personal inclination to disregard Japan in terms of the global market portfolio (beta) and in stead going for some alpha through stock picking which is obviously possible even if the overall trend is inexorably down. Go for the ones with exposure outside Japan is my advice, but that should be taken with a couple of truck loads of salt and I am ready to stand corrected any time by those much smarter than me in terms of trading equities.
The External Sector, Wither Growth
Perhaps one of the most interesting news points to come out of Japan since we last convened was the news that Japan had entered a current account deficit for the first time in a long while. This is significant for a number of reasons. First of all, it shows us the extent of the slump in that the trade balance balance has swung so fast and so much into negative territory. However, as I have argued endlessly we also need to look at income and here Japanese savers have been extraordinarily well endowed. Thus I also think that there is a technical issue to deal with here in that the income balance is likely to have swung into negative on the basis of the appreciation of the JPY we have observed in the latter part of 2008 and into the first months of 2009.
The CA deficit is not visible on the graph above but it does not take much imagination to see where the lines are going; especially not since we recently learned that Japanese exports dropped a whopping 49% year on year in February as shipments to the rest of world almost stalled completely.
Needless to say, the move of Japan's current account into deficit territory has sparked all kinds of interesting points not least in the context of Japan's impending forced rebalancing. It comes to no surprise to me that the Economist was the first to jump the gun hailing Japan's rebalancing act.
Japanese households used to be among the world’s biggest savers and, as a result, the country ran a massive trade surplus. But no longer. They now save less of their income than American households, and Japan’s trade balance moved into deficit last year (see top chart). A long-overdue—and painful—economic rebalancing is under way.
To be fair to the Economist, they do make the important qualifier that since the external balance is coming due to a collapse in external conditions rather than a shift in actual growth path it may not be exactly what the doctor ordered. Yet, the Economist also applies standard life cycle theory to suggest that as Japan grows older so will we start to observe dissaving on aggregate and thus predicts, like all those famous economic steady state models, that Japan according to theory should be running a current account deficit. I think this is way to simple and in order to move forward on this field some important adjustments need to be made to Modigliani's life cycle hypothesis and, crucially, how it applies to aggregate economies. A lot of the confusion arises in the context of Japanese households their low savings rate and the fact that Japan exactly seems to suffering from a dearth in consumption (domestic demand) and surplus of savings. In a recent piece by the New York Times this view is articulated pointing towards the obvious effect that when you have no domestic demand of any meaningful proportion you become de-facto dependent on external demand. However, Stefan Karlsson retorts that low consumer spending in Japan is the result of low growth and not the cause pointing to the historically low household savings rate in Japan.
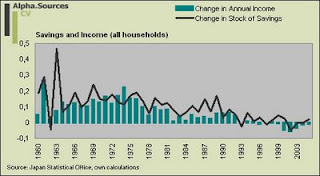
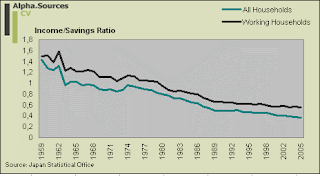
The plot thickens and at this point we simply need to get some data on the table to see what is actually going on. As a first stab let direct the attention to three crucial issues when applying individual life cycle theory to aggregate outcomes. First, you need to distinguish between working and non-working households as the savings dynamics are bound to differ markedly. Moreover, you need to incorporate some kind of uncertainty buffer to adjust for the fact that the transversality condition does not hold and thus that consumers do not dissave to 0. Secondly, you need to look at the overall stock of savings as well as the flow to increase or decrease this stock. This is very important relative to the measure of the saving rate out of disposable income. Thirdly and intimately related to point two you need to look at the evolution of income and the change in the stock of saving relative to the change in income. With these points in mind, let us consult the data.
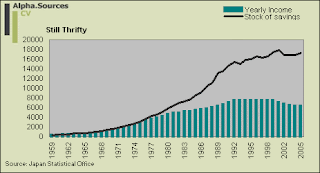
The first graph shows the evolution of annual income and the stock of savings and it represents an important picture since it shows us that Japanese households are indeed sitting on a large pile of savings measured as a stock even if as Scott Peterson showed us recently it is dwindling which indeed constitutes a worrying trend. The key point is of course what to do with those savings. Sure, one can spend them and dissave which is what would happen in a closed economy, but in an open economy the dynamics are likely to be strikingly different. Basically, this stock of savings represents a structural excess of savings on a stock basis and one of the only ways to make it count is to transfer it into income by investing abroad or by investing in export oriented domestic industries [1]. This is the only way that this saving can be transferred into investment and then into income. Consequently, Japan does suffer from a a chronic lack of domestic demand and consumption and it does so exactly because relying on consumption with the current demographic profile is not viable. Persons dissave, but societies do not since they don't have an end point or at least, a market economy has every interest in fighting off dissaving through the leakage of exporting excess saving. In this way, all the opinions introduced above get it wrong I feel because you really need to incorporate realistic assumptions on demographics. Take Mr. Karlsson's suggestion that Japanese households save more? Out of what I ask and assuming that these savings should be accumulated to invest later where would you invest it? At home (to what return) or abroad? This is exactly the key point since moving towards the NYT and their implicit narrative that Japan raises consumption the simple question is that she can't and understanding precisely why this is and what this means for the global economy is absolutely crucial. I shall spare no chance in pointing out this again and again.
Thus, if Japan wants growth it needs to make those savings count and oh boy have those Japs made it count.
Y = C + I + G + X and by definition net national savings defined as Y - C - G = I + X where X is the CA balance. [2]
“Japan’s toxic assets are essentially equities and any pick up in stock markets will be more significant for improving tier one capital,”
The ultimate dilemma for the government/BoJ is that, while a half-hearted fiscal expansion may fail to overcome the downward spiral of the economy, an overblown version risks depressing market confidence in the fiscal policy.
---
[1] - the observed decline in home bias among Japanese investors is an important part of the picture here.
[2] - Readers with basic mathematical inclination will notice that expressing the spread between investment and net exports and foreign asset income as the addition to national savings from external demand, is just a detour of expressing the current account balance as a share of GNI. Thus basic algebra gives;
I/GNI - I+(X-M)/GNI = [I - I + (X-M)]/GNI; (cancelling out the I's) gives (X-M)/GNI.


