In the Pipe, Five-by-Five
I recently said that markets were cruising for a bruising. For now, they’re just cruising, mirroring the path set by Corporal Ferro as she guides her drop ship to a perfect landing on LV-426 in James Cameron’s Aliens.
There is still little stopping risk assets, short vol is paying steady premiums for those picking up dimes in front of the proverbial steamroller, and risk-free instruments still offer 4-to-5% for anyone who feels like temporarily getting off the train. In other words, it’s very pleasant indeed for investors. From the perspective of the macro data, that’s easy to explain. Markets are still being fed information that the (global) economy is doing ok, inflation is falling and while interest rates are set to stay high, they’re also about to come down, by 50-to-100bp. Does this story still check out? Just about.
Broad-based global economic indicators have clearly improved in the past three-to-six months, and this has happened as inflation has come down. The first chart below plots my diffusion index of leading indicators* alongside the JPM global composite PMI, which rose to a nine-month high of 52.3 in March, rebounding further from its trough of 50 in October. Granted, this is happening in the context of a still-tepid overall rebound in my LEI diffusion index. Leading indicators have stopped falling, for the most part, but they are still not, collectively rising. But that doesn’t necessarily matter for cyclical momentum in the global economy. From 2014 to 2015, for example, the global PMI hovered around 53 amid the same indecisive signal from my diffusion index.
The second chart below adds to the positive vibes for the global business cycle by linking the composite PMI to a diffusion index for global policy rates. The major DM central banks might not have started their easing cycle yet, but the underlying thrust of global monetary policy has clearly shifted, all the same. Central banks are either cutting or standing pat, a clear shift from last year when everyone was still raising rates, at least until the end of the year.
Better, but still fragile
Global monetary policy has shifted
Another interesting perspective on the global business cycle comes from Simon Ward’s recent blog post in which he shows that the global inventory cycle has bottomed in the last six-to-12 months, with survey data now hinting at an upturn. This chimes with what I am seeing in the day-job analysing the Eurozone economy, though significance divergence persists between the major EZ economies. In Germany, for example, an inventory overhang remains. Obviously, economic strength could become a burden on markets to the extent that it prompts central banks to abandon their plans to cut interest rates. We certainly now see a lot of speculation about whether still-robust US employment numbers will stay the Fed’s hand. It could, but there are still a lot of NFP reports between now and the end of the year, and leading indicators suggest that the payroll data will soon take a leg down.
Is inflation still falling?
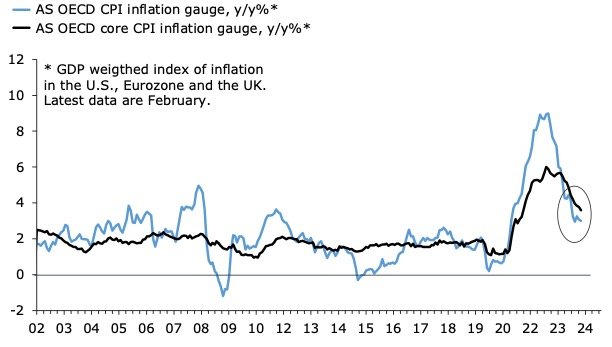
In a nutshell, yes, but the pace of decline has slowed to a trickle since Q4. In fact, my measure of DM/OECD inflation—a weighted average of headline inflation in the US, UK, and the Eurozone—has been stuck around 3% since October, but the equivalent core inflation gauge fell to a post-inflation shock low of 3.6% in February. I can’t really see the March numbers shifting the perception of sticky inflation much. The early Easter alone will boost inflation in key services components, creating the illusion of still-sticky core inflation. By April, however, I would expect to see more significant evidence of further disinflation in the core, as Easter effects reverse, and this picture should strengthen over the summer. This is certainly my expectation in Europe, and I suspect inflation elsewhere will follow the same pattern, more or less.
Still coming down?
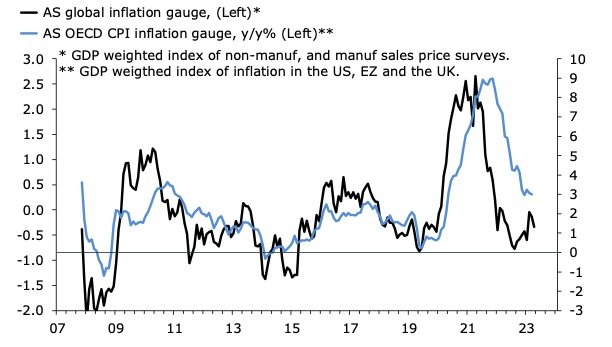
Leading survey indicators suggest that inflation will continue to fall. The first chart below shows that surveyed selling price expectations in the US, Europe and China remain consistent with DM headline inflation easing further towards 2% in the next three-to-six months, despite the fact that my aggregate survey index rebounded in Q1, from its trough in Q4. Robust labour markets, firming cyclical momentum in the global economy, and the fledgling recovery in selling price expectations need careful watching. The second chart below shows that deflation in commodities and Chinese producer prices is now easing, with the year-over-year rates in both edging close to zero, or even slightly above for commodities. That’s a warning shot across the bow for those still assuming steady disinflation in their forecasts for DM consumer prices. But at this point, the shift in global commodities price inflation isn’t really a big upside threat to DM CPIs. More generally, I have long thought that a perfect landing for DM inflation at 2% would be difficult to achieve, but in the near term, I still think the data points to further declines in headline and core inflation.
Inflation has further to fall
One to watch for the rest of 2024
Rates are behaving, for now
Fixed income punters still believe in the combination of a soft landing for the economy and lower policy rates, just about. Granted, front-end yields have crept higher as inflation and the economic data have come in hotter than central banks would like. But then again, the plunge in yields at the end of last year was always too good to be true. The first chart below shows that two-year yields remain well below their 2023 highs in the US, the UK, and the Eurozone, and consistent with a reduction in the policy rate over the next 12-to-24 months in all three markets. We get the same picture if we look at the implied policy rate from SOFR and Euribor futures—in the US and the Eurozone respectively—also signalling a gradual easing of monetary policy. I concede the threat that persistent upside surprises in inflation and employment, mainly in the US, upend this relatively benign picture in the second quarter. But at this point, it is a fair bet I think that the Fed will conform to market expectations for three-to-four rate cuts, at least.
That said, I am surprised to see fixed income volatility falling. Not too long ago, I suggested that bear-steepening during inversions could signal a looming rise in bond market volatility. That call has aged like milk left outside on a hot summer’s day. The MOVE fixed income volatility has broken lower since I put forward that hypothesis, ostensibly pulled lower by falling equity volatility. That’s all well and good, and quite pleasant for investors, but is it a stable equilibrium? Interest rates will have to move at some point, won’t they, either higher or lower depending on the signal from the economic data? I guess that an immaculate soft landing could be one in which rates fall on a low-volatility glide-path, perfectly consistent with expectations, but investors need to consider the risk that rates might deviate from that path in either direction. My friend and old colleague Simon White concurs, noting that the fall in fixed income volatility appears to be diverging from realised volatility in the CPI.
In Aliens, corporal Ferro’s perfect and uneventful landing on LV-426 briefly lulls the marines and their superior officers into the belief that they’re facing a straightforward bug hunt. If you’ve watched the movie, you’ll know that things don’t turn out to be as simple as they hope.
Still off their highs
Futures are pricing a soft landing
Fixed income volatility is breaking lower…
…pulled lower by low equity vol?
—
* Eagle-eyed readers will perhaps notice that the diffusion index looks a bit different from previous iterations shown here. I have re-jigged it to show a more constant mean-reversion pattern over time, which effectively means that it is now more symmetric around zero. It doesn’t materially change the conclusion from this model. There are many ways to structure these diffusion indices, but in the end they will be telling the same broad story.


